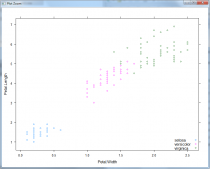
如下所示:
title(main = NULL, sub = NULL, xlab = NULL, ylab = NULL,
 line = NA, outer = FALSE, ...)
| 參數 | 描述 |
|---|---|
| main | 主標題 |
| sub | 副標題 |
| xlab | x軸標簽 |
| ylab | y軸標簽 |
| line | 到軸線的行數距離 |
| outer | 一個邏輯值。 如果為TRUE,則標題位于圖的外部邊緣. |
補充:R語言低級繪圖函數-title
title 函數用來在一張圖表上添加標題
基本用法:
main 表示主標題,通常位于圖像的上方, sub 表示副標題,位于圖像的下方, xlab 表示x軸的標簽,ylab 表示y軸的標簽
par(oma = c(1, 1, 1, 1))
plot(1:5, 1:5, xlim = c(0,6), ylim = c (0,6), type = "n", xlab = "", ylab = "")
box(which = "figure", col = "red", lwd = 2)
box(which = "plot", col = "blue", lwd = 2)
title(main = "main tilte", sub = "sub title", xlab = "xlab", ylab = "ylab")
效果圖如下:

參數設置:
col : 設置標題的顏色
cex : 設置標題的文字大小
font : 設置標題的文字的格式
以上三個參數可以針對不同的標題分別進行設置,需要注意的是xlab和ylab 不能分開設置,只能是同時設置,對應的參數為 col.lab, col.cex, font.cex
代碼示例:
plot(1:5, 1:5, xlim = c(0,6), ylim = c (0,6), type = "n", xlab = "", ylab = "")
title(main = "main tilte", sub = "sub title", xlab = "xlab", ylab = "ylab", col.main = "red", cex.sub = 1.5, col.lab = "blue")
效果圖:

outer : 邏輯值,如果為TRUE, 將標題放到plot area的外邊
代碼示例:
par(oma = c(5, 5, 3, 3))
plot(1:5, 1:5, xlim = c(0,6), ylim = c (0,6), type = "n", xlab = "", ylab = "")
box(which = "figure", col = "red", lwd = 2)
box(which = "plot", col = "blue", lwd = 2)
title(main = "main tilte", sub = "sub title", xlab = "xlab", ylab = "ylab", outer=TRUE)
效果圖如下:

title 中也允許表達式
代碼示例:
plot(1:5, 1:5, xlim = c(0,6), ylim = c (0,6), type = "n", xlab = "", ylab = "")
title(main = expression(sqrt(x)), sub = expression(x^2), xlab = "xlab", ylab = "ylab")
效果圖如下:

更多關于表達式的書寫,可以參考plotmath 函數的幫助文檔
以上為個人經驗,希望能給大家一個參考,也希望大家多多支持服務器之家。如有錯誤或未考慮完全的地方,望不吝賜教。
原文鏈接:https://blog.csdn.net/t4ngw/article/details/106006556


