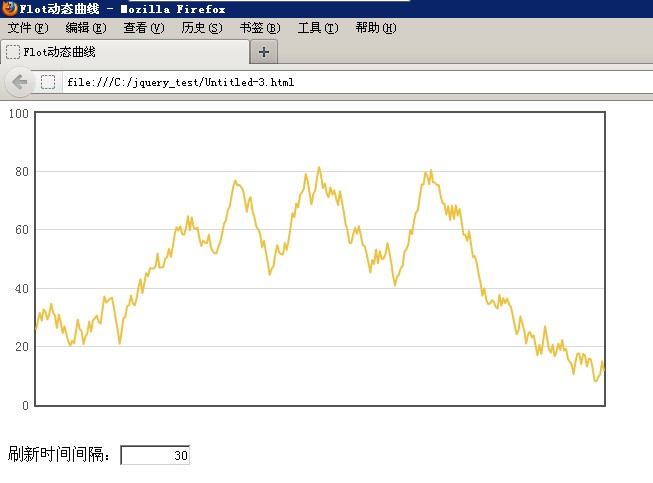
剛剛做的是一個(gè)靜態(tài)的曲線圖,只要設(shè)置數(shù)據(jù),就可以直接顯示。下面來(lái)做一個(gè)根據(jù)時(shí)間間隔根據(jù)新數(shù)據(jù)一直變的曲線繪圖示例。
同樣,為了兼容不同瀏覽器,請(qǐng)一定要引入三個(gè)JS文件,否則不保證在IE下的運(yùn)行。
首先來(lái)看一下效果!

刷新間隔的實(shí)現(xiàn)其實(shí)就是定時(shí)調(diào)用某個(gè)函數(shù),這個(gè)函數(shù)將繪圖對(duì)象里面的數(shù)據(jù)更新即可。
我們來(lái)看一下代碼:
|
1
2
3
4
5
6
7
8
9
10
11
12
13
14
15
16
17
18
19
20
21
22
23
24
25
26
27
28
29
30
31
32
33
34
35
36
37
38
39
40
41
42
43
44
45
46
47
48
49
50
51
52
53
54
55
56
57
58
59
60
61
62
63
64
65
66
67
68
69
70
|
<!DOCTYPE html PUBLIC "-//W3C//DTD XHTML 1.0 Transitional//EN" "http://www.w3.org/TR/xhtml1/DTD/xhtml1-transitional.dtd"> <html xmlns="http://www.w3.org/1999/xhtml"> <head> <meta http-equiv="Content-Type" content="text/html; charset=gb2312" /> <title>Flot動(dòng)態(tài)曲線</title> <!--[if lte IE 8]><script language="javascript" type="text/javascript" src="excanvas.min.js"></script><![endif]--> <script language="javascript" type="text/javascript" src="jquery.js"></script> <script language="javascript" type="text/javascript" src="jquery.flot.js"></script> <script type="text/javascript"> $(function () { // 要繪制的數(shù)據(jù)和數(shù)據(jù)的數(shù)據(jù)點(diǎn)數(shù) var data = [], totalPoints = 300; // 獲得一些隨機(jī)數(shù)據(jù) function getRandomData() { if (data.length > 0) datadata = data.slice(1); while (data.length < totalPoints) { var prev = data.length > 0 ? data[data.length - 1] : 50; var y = prev + Math.random() * 10 - 5; if (y < 0) y = 0; if (y > 100) y = 100; data.push(y); } var res = []; for (var i = 0; i < data.length; ++i) res.push([i, data[i]]) return res; } var updateInterval = 30; // 刷新間隔 // 更改刷新間隔時(shí)間 $("#updateInterval").val(updateInterval).change(function () { var v = $(this).val(); if (v && !isNaN(+v)) { updateInterval = +v; if (updateInterval < 1) updateInterval = 1; if (updateInterval > 2000) updateInterval = 2000; $(this).val("" + updateInterval); } }); // 設(shè)置繪圖參數(shù) var options = { series: { shadowSize: 0 }, // 繪制線的陰影,不繪制設(shè)置 0 yaxis: { min: 0, max: 100 }, // Y 軸的最大值最小值 xaxis: { show: false } // 不顯示 X 軸 }; // 繪圖對(duì)象 參數(shù)為:繪制地點(diǎn)、數(shù)據(jù)、屬性 var plot = $.plot($("#placeholder"), [ getRandomData() ], options); function update() { // 要實(shí)現(xiàn)動(dòng)態(tài)繪圖,只需重新設(shè)置其數(shù)據(jù)即可 plot.setData([ getRandomData() ]); // 設(shè)置數(shù)據(jù) // 軸線不改變,不用調(diào)用 plot.setupGrid() plot.draw(); // 設(shè)置調(diào)用 setTimeout(update, updateInterval); } // 加載調(diào)用 update(); }); </script> </head> <body> <div id="placeholder" style="width:600px;height:300px;"></div> <br><br> 刷新時(shí)間間隔:<input id="updateInterval" type="text" value="" style="text-align: right; width:5em"> </body> </html> |
輸入不同的刷新間隔,繪圖的速度會(huì)響應(yīng)的調(diào)整。以上示例來(lái)自官方,少做修改并加以注釋?zhuān)M麑?duì)一些人有所幫助。
以上就是本文的全部?jī)?nèi)容,希望對(duì)大家的學(xué)習(xí)有所幫助,也希望大家多多支持服務(wù)器之家。
原文鏈接:https://www.iteye.com/blog/cuisuqiang-1462615


