前言
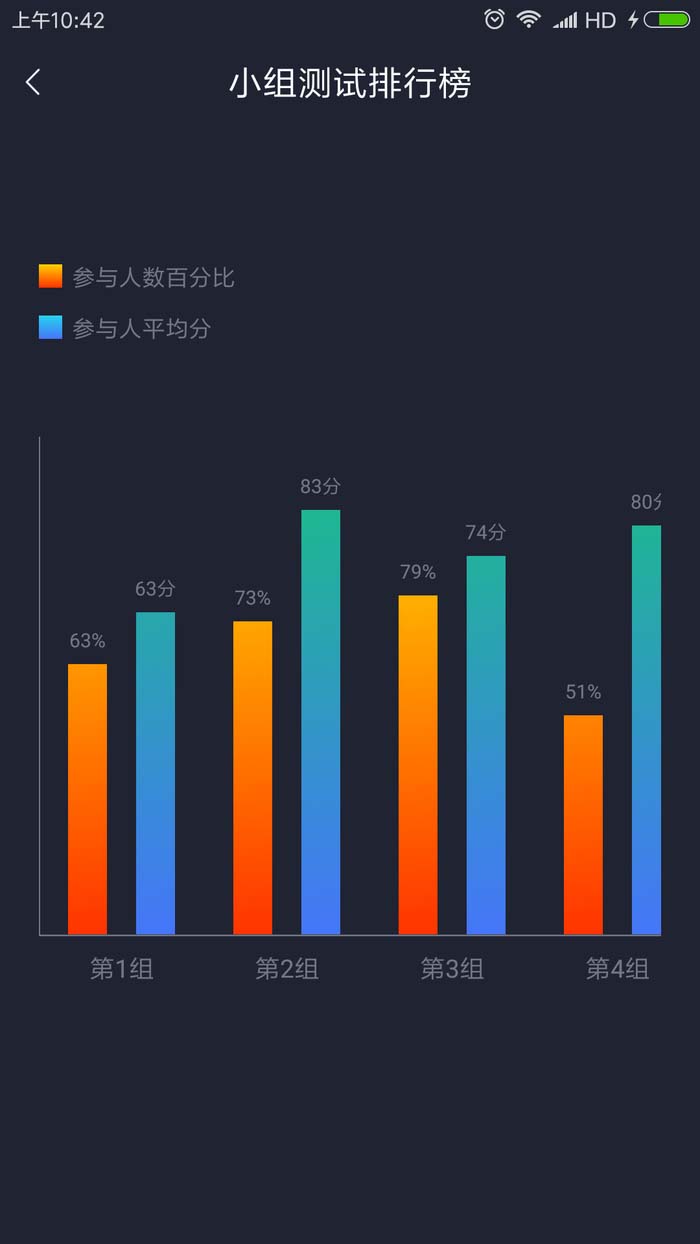
本文將通過示例代碼介紹如何自定義簡單的直方圖表,此圖表并非常見的直方圖表,而是可以分組的。此文不會過多涉及原理,比較簡單,示例圖片如下(gif圖片沒有制作好,有閃爍,請見諒):

對于該示例的代碼實現,其實重點在于坐標軸、文字、直方圖的位置控制,需要隨滑動距離而動態更新。注意事項會在示例代碼中標注。下面貼出示例代碼
|
1
2
3
4
5
6
7
8
9
10
11
12
13
14
15
16
17
18
19
20
21
22
23
24
25
26
27
28
29
30
31
32
33
34
35
36
37
38
39
40
41
42
43
44
45
46
47
48
49
50
51
52
53
54
55
56
57
58
59
60
61
62
63
64
65
66
67
68
69
70
71
72
73
74
75
76
77
78
79
80
81
82
83
84
85
86
87
88
89
90
91
92
93
94
95
96
97
98
99
100
101
102
103
104
105
106
107
108
109
110
111
112
113
114
115
116
117
118
119
120
121
122
123
124
125
126
127
128
129
130
131
132
133
134
135
136
137
138
139
140
141
142
143
144
145
146
147
148
149
150
151
152
153
154
155
156
157
158
159
160
161
162
163
164
165
166
167
168
169
170
171
172
173
174
175
176
177
178
179
180
181
182
183
184
185
186
187
188
189
190
191
192
193
194
195
196
197
198
199
200
201
202
203
204
205
206
207
208
209
210
211
212
213
214
215
216
217
218
219
220
221
222
223
224
225
226
227
228
229
230
231
232
233
234
235
236
237
238
239
240
241
242
243
244
245
246
247
248
249
250
251
252
253
254
255
256
257
258
259
260
261
262
263
264
265
266
267
268
269
270
271
272
273
274
275
276
277
278
279
280
281
282
283
284
285
286
287
288
289
290
291
292
293
294
295
296
297
298
299
300
301
302
303
304
305
306
307
308
309
310
311
312
313
314
315
316
317
318
319
|
public class MultiGroupHistogramView extends View { private int width; private int height; // 坐標軸線寬度 private int coordinateAxisWidth; // 組名稱字體大小 private int groupNameTextSize; // 小組之間間距 private int groupInterval; // 組內子直方圖間距 private int histogramInterval; private int histogramValueTextSize; // 圖表數值小數點位數 private int histogramValueDecimalCount; private int histogramHistogramWidth; private int chartPaddingTop; private int histogramPaddingStart; private int histogramPaddingEnd; // 各組名稱到X軸的距離 private int distanceFormGroupNameToAxis; // 直方圖上方數值到直方圖的距離 private int distanceFromValueToHistogram; // 直方圖最大高度 private int maxHistogramHeight; // 軸線畫筆 private Paint coordinateAxisPaint; // 組名畫筆 private Paint groupNamePaint; private Paint.FontMetrics groupNameFontMetrics; private Paint.FontMetrics histogramValueFontMetrics; // 直方圖數值畫筆 private Paint histogramValuePaint; // 直方圖畫筆 private Paint histogramPaint; // 直方圖繪制區域 private Rect histogramPaintRect; // 直方圖表視圖總寬度 private int histogramContentWidth; // 存儲組內直方圖shader color,例如,每組有3個直方圖,該SparseArray就存儲3個相對應的shader color private SparseArray<int[]> histogramShaderColorArray; private List<MultiGroupHistogramGroupData> dataList; private SparseArray<Float> childMaxValueArray; private Scroller scroller; private int minimumVelocity; private int maximumVelocity; private VelocityTracker velocityTracker; public MultiGroupHistogramView(Context context) { this(context, null); } public MultiGroupHistogramView(Context context, @Nullable AttributeSet attrs) { this(context, attrs, 0); } public MultiGroupHistogramView(Context context, @Nullable AttributeSet attrs, int defStyleAttr) { super(context, attrs, defStyleAttr); init(attrs); } private void init(AttributeSet attrs) { setLayerType(View.LAYER_TYPE_HARDWARE, null); TypedArray typedArray = getContext().obtainStyledAttributes(attrs, R.styleable.MultiGroupHistogramView); coordinateAxisWidth = typedArray.getDimensionPixelSize(R.styleable.MultiGroupHistogramView_coordinateAxisWidth, DisplayUtil.dp2px(2)); // 坐標軸線顏色 int coordinateAxisColor = typedArray.getColor(R.styleable.MultiGroupHistogramView_coordinateAxisColor, Color.parseColor("#434343")); // 底部小組名稱字體顏色 int groupNameTextColor = typedArray.getColor(R.styleable.MultiGroupHistogramView_groupNameTextColor, Color.parseColor("#CC202332")); groupNameTextSize = typedArray.getDimensionPixelSize(R.styleable.MultiGroupHistogramView_groupNameTextSize, DisplayUtil.dp2px(15)); groupInterval = typedArray.getDimensionPixelSize(R.styleable.MultiGroupHistogramView_groupInterval, DisplayUtil.dp2px(30)); histogramInterval = typedArray.getDimensionPixelSize(R.styleable.MultiGroupHistogramView_histogramInterval, DisplayUtil.dp2px(10)); // 直方圖數值文本顏色 int histogramValueTextColor = typedArray.getColor(R.styleable.MultiGroupHistogramView_histogramValueTextColor, Color.parseColor("#CC202332")); histogramValueTextSize = typedArray.getDimensionPixelSize(R.styleable.MultiGroupHistogramView_histogramValueTextSize, DisplayUtil.dp2px(12)); histogramValueDecimalCount = typedArray.getInt(R.styleable.MultiGroupHistogramView_histogramValueDecimalCount, 0); histogramHistogramWidth = typedArray.getDimensionPixelSize(R.styleable.MultiGroupHistogramView_histogramHistogramWidth, DisplayUtil.dp2px(20)); chartPaddingTop = typedArray.getDimensionPixelSize(R.styleable.MultiGroupHistogramView_chartPaddingTop, DisplayUtil.dp2px(10)); histogramPaddingStart = typedArray.getDimensionPixelSize(R.styleable.MultiGroupHistogramView_histogramPaddingStart, DisplayUtil.dp2px(15)); histogramPaddingEnd = typedArray.getDimensionPixelSize(R.styleable.MultiGroupHistogramView_histogramPaddingEnd, DisplayUtil.dp2px(15)); distanceFormGroupNameToAxis = typedArray.getDimensionPixelSize(R.styleable.MultiGroupHistogramView_distanceFormGroupNameToAxis, DisplayUtil.dp2px(15)); distanceFromValueToHistogram = typedArray.getDimensionPixelSize(R.styleable.MultiGroupHistogramView_distanceFromValueToHistogram, DisplayUtil.dp2px(10)); typedArray.recycle(); coordinateAxisPaint = new Paint(Paint.ANTI_ALIAS_FLAG); coordinateAxisPaint.setStyle(Paint.Style.FILL); coordinateAxisPaint.setStrokeWidth(coordinateAxisWidth); coordinateAxisPaint.setColor(coordinateAxisColor); groupNamePaint = new Paint(Paint.ANTI_ALIAS_FLAG); groupNamePaint.setTextSize(groupNameTextSize); groupNamePaint.setColor(groupNameTextColor); groupNameFontMetrics = groupNamePaint.getFontMetrics(); histogramValuePaint = new Paint(Paint.ANTI_ALIAS_FLAG); histogramValuePaint.setTextSize(histogramValueTextSize); histogramValuePaint.setColor(histogramValueTextColor); histogramValueFontMetrics = histogramValuePaint.getFontMetrics(); histogramPaintRect = new Rect(); histogramPaint = new Paint(Paint.ANTI_ALIAS_FLAG); scroller = new Scroller(getContext(), new LinearInterpolator()); ViewConfiguration configuration = ViewConfiguration.get(getContext()); minimumVelocity = configuration.getScaledMinimumFlingVelocity(); maximumVelocity = configuration.getScaledMaximumFlingVelocity(); } @Override protected void onMeasure(int widthMeasureSpec, int heightMeasureSpec) { super.onMeasure(widthMeasureSpec, heightMeasureSpec); width = getMeasuredWidth(); height = getMeasuredHeight(); maxHistogramHeight = height - groupNameTextSize - coordinateAxisWidth - distanceFormGroupNameToAxis - distanceFromValueToHistogram - histogramValueTextSize - chartPaddingTop; } /** * 判斷是否可以水平滑動 * @param direction 標識滑動方向 正數:右滑(手指從右至左移動);負數:左滑(手指由左向右移動) * 您可參考ScaollView或HorizontalScrollView理解滑動方向 */ @Override public boolean canScrollHorizontally(int direction) { if (direction > 0) { return histogramContentWidth - getScrollX() - width + histogramPaddingStart + histogramPaddingEnd > 0; } else { return getScrollX() > 0; } } /** * 根據滑動方向獲取最大可滑動距離 * @param direction 標識滑動方向 正數:右滑(手指從右至左移動);負數:左滑(手指由左向右移動) * 您可參考ScaollView或HorizontalScrollView理解滑動方向 */ private int getMaxCanScrollX(int direction) { if (direction > 0) { return histogramContentWidth - getScrollX() - width + histogramPaddingStart + histogramPaddingEnd > 0 ? histogramContentWidth - getScrollX() - width + histogramPaddingStart + histogramPaddingEnd : 0; } else if (direction < 0) { return getScrollX(); } return 0; } private float lastX; @Override public boolean onTouchEvent(MotionEvent event) { initVelocityTrackerIfNotExists(); velocityTracker.addMovement(event); switch (event.getAction()) { case MotionEvent.ACTION_DOWN: { if (!scroller.isFinished()) { scroller.abortAnimation(); } lastX = event.getX(); return true; } case MotionEvent.ACTION_MOVE: { int deltaX = (int) (event.getX() - lastX); lastX = event.getX(); // 滑動處理 if (deltaX > 0 && canScrollHorizontally(-1)) { scrollBy(-Math.min(getMaxCanScrollX(-1), deltaX), 0); } else if (deltaX < 0 && canScrollHorizontally(1)) { scrollBy(Math.min(getMaxCanScrollX(1), -deltaX), 0); } break; } case MotionEvent.ACTION_UP: { velocityTracker.computeCurrentVelocity(1000, maximumVelocity); int velocityX = (int) velocityTracker.getXVelocity(); fling(velocityX); recycleVelocityTracker(); break; } case MotionEvent.ACTION_CANCEL: { recycleVelocityTracker(); break; } } return super.onTouchEvent(event); } private void initVelocityTrackerIfNotExists() { if (velocityTracker == null) { velocityTracker = VelocityTracker.obtain(); } } private void recycleVelocityTracker() { if (velocityTracker != null) { velocityTracker.recycle(); velocityTracker = null; } } // ACTION_UP事件觸發 private void fling(int velocityX) { if (Math.abs(velocityX) > minimumVelocity) { if (Math.abs(velocityX) > maximumVelocity) { velocityX = maximumVelocity * velocityX / Math.abs(velocityX); } scroller.fling(getScrollX(), getScrollY(), -velocityX, 0, 0, histogramContentWidth + histogramPaddingStart - width, 0, 0); } } @Override public void computeScroll() { if (scroller.computeScrollOffset()) { scrollTo(scroller.getCurrX(), 0); } } public void setDataList(@NonNull List<MultiGroupHistogramGroupData> dataList) { this.dataList = dataList; if (childMaxValueArray == null) { childMaxValueArray = new SparseArray<>(); } else { childMaxValueArray.clear(); } histogramContentWidth = 0; for (MultiGroupHistogramGroupData groupData : dataList) { List<MultiGroupHistogramChildData> childDataList = groupData.getChildDataList(); if (childDataList != null && childDataList.size() > 0) { for (int i = 0; i < childDataList.size(); i++) { histogramContentWidth += histogramHistogramWidth + histogramInterval; MultiGroupHistogramChildData childData = childDataList.get(i); Float childMaxValue = childMaxValueArray.get(i); if (childMaxValue == null || childMaxValue < childData.getValue()) { childMaxValueArray.put(i, childData.getValue()); } } histogramContentWidth += groupInterval - histogramInterval; } } histogramContentWidth += -groupInterval; } /** * 設置組內直方圖顏色(并不是設置所有直方圖顏色,而是根據每組數據內直方圖數量設置) */ public void setHistogramColor(int[]... colors) { if (colors != null && colors.length > 0) { if (histogramShaderColorArray == null) { histogramShaderColorArray = new SparseArray<>(); } else { histogramShaderColorArray.clear(); } for (int i = 0; i < colors.length; i++) { histogramShaderColorArray.put(i, colors[i]); } } } @Override protected void onDraw(Canvas canvas) { if (width == 0 || height == 0) { return; } int scrollX = getScrollX(); int axisBottom = height - groupNameTextSize - distanceFormGroupNameToAxis - coordinateAxisWidth / 2; canvas.drawLine(coordinateAxisWidth / 2 + scrollX, 0, coordinateAxisWidth / 2 + scrollX, axisBottom, coordinateAxisPaint); canvas.drawLine(scrollX, axisBottom, width + scrollX, axisBottom, coordinateAxisPaint); if (dataList != null && dataList.size() > 0) { int xAxisOffset = histogramPaddingStart; // 每個直方圖在x軸的偏移量 for (MultiGroupHistogramGroupData groupData : dataList) { List<MultiGroupHistogramChildData> childDataList = groupData.getChildDataList(); if (childDataList != null && childDataList.size() > 0) { int groupWidth = 0; for (int i = 0; i < childDataList.size(); i++) { MultiGroupHistogramChildData childData = childDataList.get(i); histogramPaintRect.left = xAxisOffset; histogramPaintRect.right = histogramPaintRect.left + histogramHistogramWidth; int childHistogramHeight; if (childData.getValue() <= 0 || childMaxValueArray.get(i) <= 0) { childHistogramHeight = 0; } else { childHistogramHeight = (int) (childData.getValue() / childMaxValueArray.get(i) * maxHistogramHeight); } histogramPaintRect.top = height - childHistogramHeight - coordinateAxisWidth - distanceFormGroupNameToAxis - groupNameTextSize; histogramPaintRect.bottom = histogramPaintRect.top + childHistogramHeight; int[] histogramShaderColor = histogramShaderColorArray.get(i); LinearGradient shader = null; if (histogramShaderColor != null && histogramShaderColor.length > 0) { shader = getHistogramShader(histogramPaintRect.left, chartPaddingTop + distanceFromValueToHistogram + histogramValueTextSize, histogramPaintRect.right, histogramPaintRect.bottom, histogramShaderColor); } histogramPaint.setShader(shader); canvas.drawRect(histogramPaintRect, histogramPaint); String childHistogramHeightValue = StringUtil.NumericScaleByFloor(String.valueOf(childData.getValue()), histogramValueDecimalCount) + childData.getSuffix(); float valueTextX = xAxisOffset + (histogramHistogramWidth - histogramValuePaint.measureText(childHistogramHeightValue)) / 2; // 數值繪制Y軸位置特別處理 float valueTextY = histogramPaintRect.top - distanceFormGroupNameToAxis + (histogramValueFontMetrics.bottom) / 2; canvas.drawText(childHistogramHeightValue, valueTextX, valueTextY, histogramValuePaint); int deltaX = i < childDataList.size() - 1 ? histogramHistogramWidth + histogramInterval : histogramHistogramWidth; groupWidth += deltaX; // 注意此處偏移量累加 xAxisOffset += i == childDataList.size() - 1 ? deltaX + groupInterval : deltaX; } String groupName = groupData.getGroupName(); float groupNameTextWidth = groupNamePaint.measureText(groupName); float groupNameTextX = xAxisOffset - groupWidth - groupInterval + (groupWidth - groupNameTextWidth) / 2; // 組名繪制Y軸位置特別處理 float groupNameTextY = (height - groupNameFontMetrics.bottom / 2); canvas.drawText(groupName, groupNameTextX, groupNameTextY, groupNamePaint); } } } } private LinearGradient getHistogramShader(float x0, float y0, float x1, float y1, int[] colors) { return new LinearGradient(x0, y0, x1, y1, colors, null, Shader.TileMode.CLAMP); }} |
代碼就這一點,閱讀起來應該不難,如有疑問歡迎留言
自定義屬性如下:
|
1
2
3
4
5
6
7
8
9
10
11
12
13
14
15
16
17
18
19
20
21
22
|
<declare-styleable name="MultiGroupHistogramView"> <attr name="coordinateAxisWidth" format="dimension" /> <attr name="coordinateAxisColor" format="color" /> <attr name="groupNameTextColor" format="color" /> <attr name="groupNameTextSize" format="dimension" /> <attr name="groupInterval" format="dimension" /> <attr name="histogramInterval" format="dimension" /> <attr name="histogramValueTextColor" format="color" /> <attr name="histogramValueTextSize" format="dimension" /> <attr name="histogramHistogramWidth" format="dimension" /> <attr name="histogramPaddingStart" format="dimension" /> <attr name="histogramPaddingEnd" format="dimension" /> <attr name="chartPaddingTop" format="dimension" /> <attr name="distanceFormGroupNameToAxis" format="dimension" /> <attr name="distanceFromValueToHistogram" format="dimension" /> <!--圖表數值小數點位數--> <attr name="histogramValueDecimalCount"> <enum name="ZERO" value="0" /> <enum name="ONE" value="1" /> <enum name="TWO" value="2" /> </attr></declare-styleable> |
下面貼出使用方法:
|
1
2
3
4
5
6
7
8
9
10
11
12
13
14
15
16
17
18
19
20
21
22
23
24
25
26
27
28
|
private void initMultiGroupHistogramView() { Random random = new Random(); int groupSize = random.nextInt(5) + 10; List<MultiGroupHistogramGroupData> groupDataList = new ArrayList<>(); // 生成測試數據 for (int i = 0; i < groupSize; i++) { List<MultiGroupHistogramChildData> childDataList = new ArrayList<>(); MultiGroupHistogramGroupData groupData = new MultiGroupHistogramGroupData(); groupData.setGroupName("第" + (i + 1) + "組"); MultiGroupHistogramChildData childData1 = new MultiGroupHistogramChildData(); childData1.setSuffix("分"); childData1.setValue(random.nextInt(50) + 51); childDataList.add(childData1); MultiGroupHistogramChildData childData2 = new MultiGroupHistogramChildData(); childData2.setSuffix("%"); childData2.setValue(random.nextInt(50) + 51); childDataList.add(childData2); groupData.setChildDataList(childDataList); groupDataList.add(groupData); } multiGroupHistogramView.setDataList(groupDataList); int[] color1 = new int[]{getResources().getColor(R.color.color_orange), getResources().getColor(R.color.colorPrimary)}; int[] color2 = new int[]{getResources().getColor(R.color.color_supper_tip_normal), getResources().getColor(R.color.bg_supper_selected)}; // 設置直方圖顏色 multiGroupHistogramView.setHistogramColor(color1, color2);} |
完整示例:https://github.com/670832188/TestApp
總結
以上就是這篇文章的全部內容了,希望本文的內容對大家的學習或者工作具有一定的參考學習價值,如果有疑問大家可以留言交流,謝謝大家對服務器之家的支持。
原文鏈接:https://www.jianshu.com/p/1595ce6aa3a7


