可以讓我們將數據用表格的方式展示出來
安裝方式
pip install PrettyTable
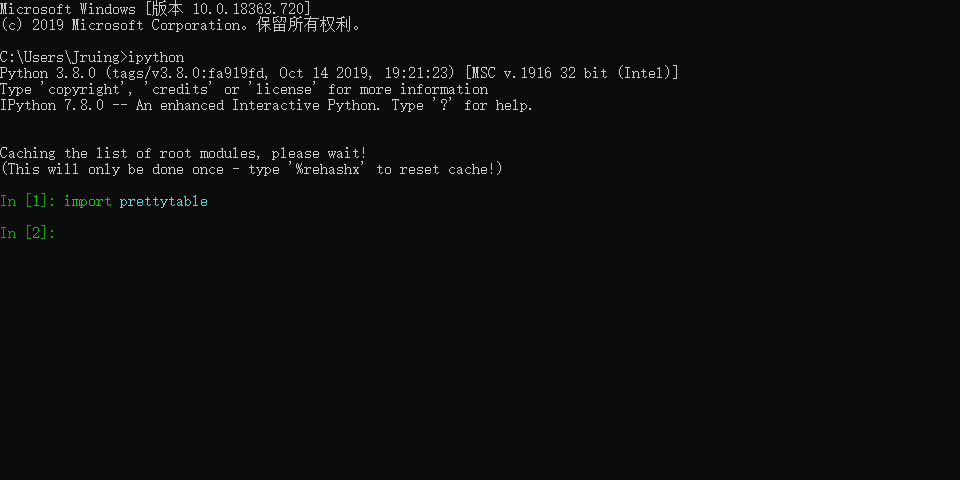
測試是否安裝成功

使用方法與對比增加一條數據
先簡單的看下如何使用以及效果
|
1
2
3
4
5
6
7
|
import prettytabletable = prettytable.PrettyTable()# 定義表頭table.field_names = ['name','age','sex']# 增加一行數據,列表里的元素按照順序對應表頭table.add_row(['Jruing','23','男'])print(table) |
效果

增加一個字段
|
1
2
3
4
5
6
7
8
9
10
|
import prettytabletable = prettytable.PrettyTable()# 定義表頭table.field_names = ['name','age','sex']# 增加一行數據,列表里的元素按照順序對應表頭table.add_row(['Jruing','23','男'])table.add_row(['Jruing','24','男'])# 增加一列,第一個參數是字段,第二個是每行數據新增字段的值table.add_column('addr',['bj','sx'])print(table) |
效果

常用的幾個方法
|
1
2
|
table.get_html_string() # 將數據轉換為html中的table標簽table.get_string(fields=['name'],start=1,end=2) # 獲取指定列的數據,start是從第幾行開始,end是到第幾行結束 |
以上就是本文的全部內容,希望對大家的學習有所幫助,也希望大家多多支持服務器之家。
原文鏈接:https://www.cnblogs.com/jruing/p/12639004.html


