現實的工作中, 數據不可能寫死的,所有的數據都應該通過發送請求進行獲取。
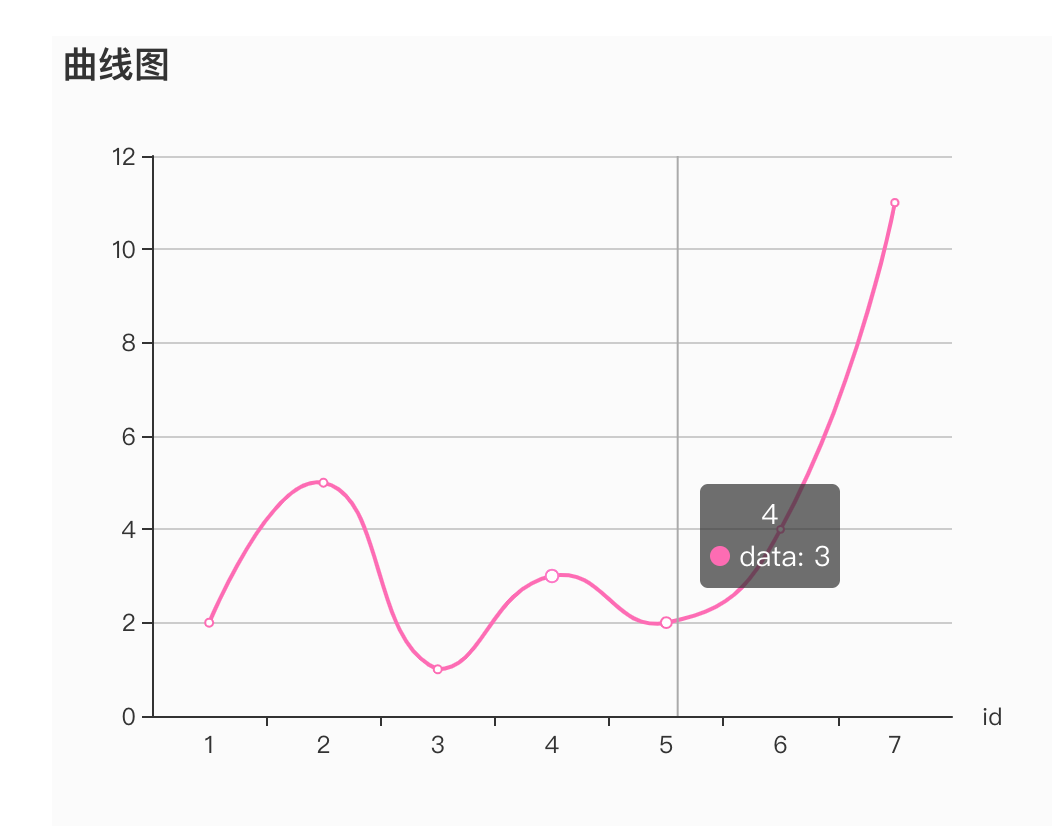
所以本項目的需求是請求服務器獲得二維數組,并生成曲線圖。曲線圖的橫縱坐標均從獲得的數據中取得。
Echarts官方文檔:
https://ecomfe.github.io/echarts-doc/public/en/index.html
前端框架使用vue,服務器使用express搭建,交互使用axios。
一.引入vue-resource
通過npm下載vue-resource
|
1
|
npm install vue-resource --save |
在main.js中引入vue-resource并注冊
|
1
2
3
4
|
// main.jsimport VueResource from 'vue-resource'Vue.use(VueResource) |
二.設置aysnc-lineChart-option.js
將該曲線圖的沒有數據的option抽取到async-lineChart-option.js中。
此代碼在src/echarts/aysnc-lineChart-option.js文件中,代碼如下。
|
1
2
3
4
5
6
7
8
9
10
11
12
13
14
15
16
17
18
19
20
21
22
23
|
export const option = { title: { text: '曲線圖' }, backgroundColor: '#FBFBFB', tooltip: { trigger:'axis' }, xAxis: { data: [], name: 'id' }, yAxis: {}, series: [{ name: 'data', type: 'line', data: [], smooth : true, itemStyle: { normal: { color: 'hotpink' } } }]} |
三.在Curve.vue中請求數據
1.從async-lineChart-option.js中引入option
2.在methods中添加drawLineChart()方法
3.在mounted()鉤子函數中調用drawBarChart()
4.添加加載動畫,在drawLineChart()方法中添加showLoading()和hideLoading()
此代碼在src/views/Curve.vue中,代碼如下:
|
1
2
3
4
5
6
7
8
9
10
11
12
13
14
15
16
17
18
19
20
21
22
23
24
25
26
27
28
29
30
31
32
33
34
35
36
37
38
39
40
41
42
43
44
45
46
47
48
49
50
51
52
53
54
55
56
57
58
|
<script> import {option} from '../echarts/aysnc-lineChart-option.js' //從aysnc-lineChart-option.js中引入option export default { name: 'Curve', mounted() { //調用drawLineChart() this.drawLineChart(); }, data () { return { } }, methods:{ drawLineChart() { // 基于準備好的dom,初始化echarts實例 var myChart = this.$echarts.init(document.getElementById('myChart')); // 繪制基本圖表 myChart.setOption(option); //顯示加載動畫 myChart.showLoading(); //獲取數據 this.$axios.get('/getdate').then(res => { //將json對象的所有id數據組成一個數組 var id = []; for(let i = 0;i < res.data.length;i++){ id.push(res.data[i].id); } //將json對象中的所有data數據組成一個數組 var data = []; for(let i = 0;i < res.data.length;i++){ data.push(res.data[i].data); } setTimeout(()=>{ //為了讓加載動畫效果明顯,這里加入了setTimeout,實現300ms延時 myChart.hideLoading(); //隱藏加載動畫 myChart.setOption({ xAxis: { data: id }, series: [{ data: data }] }) }, 300 ) }) }, }, };</script> |
四.效果圖

以上就是在vue中使用Echarts畫曲線圖的示例的詳細內容,更多關于vue Echarts畫曲線圖的資料請關注服務器之家其它相關文章!
原文鏈接:https://www.cnblogs.com/gg-qq/p/10579501.html


